

Excel, Python or R? Tools Every PGDM Business Analytics Student Should Learn
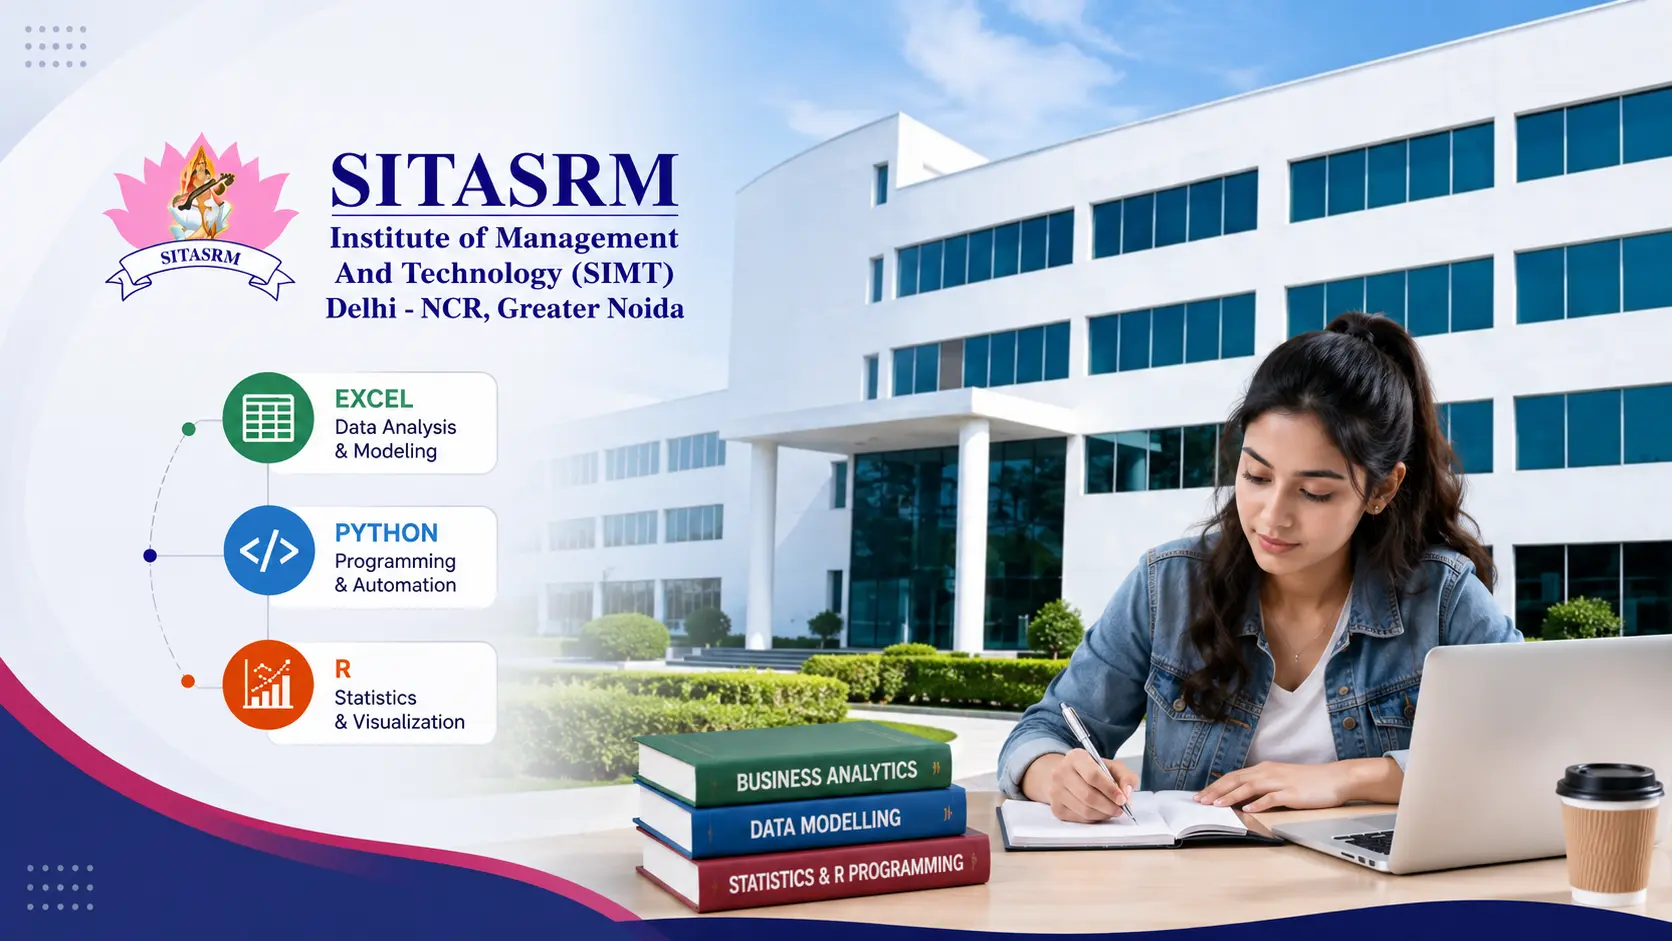
Walk into any placement interview for an analytics or strategy role today, and you'll be asked some version of the same question: "Show me how you'd solve this with the data." The answer almost always involves Excel, Python, or R — sometimes all three. This is exactly why choosing a PGDM Business Analytics specialization has become one of the smartest career moves a management graduate can make, and why understanding these three tools before you even start the program gives you a genuine head start.
Why Tool Selection Matters in a PGDM Business Analytics Program
A well-designed PGDM business analytics track doesn't just teach you what these tools are — it teaches you when to use each one on real business problems under real deadlines. At SITASRM Institute of Management And Technology (SIMT), Greater Noida, this thinking is built directly into the AICTE-approved, two-year, six-trimester PGDM programme, where business analytics is offered as a dedicated major and minor specialisation stream alongside finance, marketing, HRM, and entrepreneurship. Students don't just study analytics in theory; from Trimester I itself, courses like AI for Managers and Business Information Systems build the technological base before advanced electives such as Generative AI, Machine Learning, Data Visualisation, and Big Data Analysis take over in the second year. That is the kind of structured, industry-relevant progression a PGDM Business Analytics aspirant should be looking for in any institute.
Excel: The Foundation Every Business Analytics Student Needs
Excel remains the starting point for most business problems, and no PGDM Business Analytics student should underestimate it. It is quick, visual, and universally understood by managers who may never open a Jupyter notebook. Pivot tables, VLOOKUP/XLOOKUP, conditional formatting, and what-if analysis let students build financial models, sales dashboards, and quick forecasts without writing a single line of code. At SIMT, this foundation is laid early through courses like IT Tools for Managers and Business Statistics in the very first trimester, ensuring every student walks into their analytics electives already comfortable with spreadsheets.
Excel also builds the analytical intuition that later makes Python and R easier to grasp—concepts like filtering data, aggregating totals, and spotting outliers are first learned on a spreadsheet before they are automated in code. For internal reporting, budget planning, and client-facing summaries, Excel is often still the fastest and most expected format in Indian corporates, which is precisely the kind of role many PGDM graduates step into during their mandatory summer internship.
Python: The Workhorse for Scale and Automation
Once datasets grow beyond a few thousand rows or a task needs to be repeated every week, Excel starts to slow down — and this is where Python takes over. Its libraries for data cleaning, statistical modelling, and machine learning allow students to build classification models, run predictive algorithms, and automate reporting pipelines. This is why SIMT's PGDM Business Analytics elective basket includes dedicated courses such as Prediction Algorithm Design & Machine Learning, Database Systems & Data Mining, and Complex Networks & Cloud Computing – subjects built around exactly the kind of Python-driven skillset recruiters now list as a baseline requirement, not a bonus.
Python also connects easily with databases and live data sources, so a student can pull information, process it, and generate insights without manual copy-pasting. For a PGDM Business Analytics student aiming at roles in fintech, e-commerce, or consulting, this hands-on exposure — reinforced through SIMT's case-based and project-driven pedagogy — makes the difference between a resume that lists Python and a candidate who can actually demonstrate it in an interview.
R: The Statistician's Choice
R sometimes gets overshadowed by Python, but it still holds ground in specific areas — particularly rigorous statistical testing, econometrics, and advanced data visualization. Students who gravitate toward electives like Applied Econometrics or Advanced Data Analysis often find R's statistical packages more intuitive for hypothesis testing and building publication-quality charts.
R becomes especially valuable during the Multidisciplinary Action Project (MAP) — SIMT's six-credit capstone where students apply cross-functional knowledge to solve a real business problem — as well as in electives like HR Analytics and Finance & Risk Analytics, where statistical accuracy carries as much weight as the final business recommendation.
So, Which One Should a PGDM Business Analytics Student Learn First?
The honest answer is all three, but in a sequence — and the strength of your programme decides whether you actually get there. Excel comes first, building the foundational logic used everywhere from board meetings to internship reports. Python follows as the primary tool for handling larger datasets, automation, and machine learning. R is then layered in through specialised electives where statistical depth matters most.
This is exactly the sequence built into SIMT's PGDM Business Analytics specialisation: spreadsheets and statistics in Trimester I, core business analytics in Trimester III, and a full runway of advanced electives — Generative AI, Machine Learning, Big Data Analysis, Data Visualisation, HR Analytics, Supply Chain Analytics, and more — across the second year. Add a mandatory internship, a capstone MAP project, and a curriculum built by a faculty team combining academic rigour with industry experience, and you get a toolkit designed for how businesses actually work today, not just how a textbook describes them.
Conclusion
There is no single winner in the Excel versus Python versus R debate — each tool earns its place at a different stage of the analytics workflow, and the technologically advancing world of business rewards those who can move fluidly between all three. What matters most is where you learn to do this and how seriously that institute takes hands-on, industry-integrated learning over rote theory. If you're serious about a career in analytics, business intelligence, or data-driven decision-making, the PGDM Business Analytics specialization at SITASRM Institute of Management And Technology, Greater Noida, is built to take you there — from spreadsheet fundamentals in Trimester I to Generative AI and Machine Learning electives by your final year. Admissions for the 2026-28 batch are now open. Explore the programme, and apply today to start building the skillset that will keep you ahead in a world where technology no longer waits for anyone.
Table Of Content
- Loading...
